Dashboard Development Services
Transform Data into Actionable Insights with Custom, Cloud-Based Dashboards
1. Overview
BD Tim Z Company specializes in designing, developing, and deploying tailored dashboards that consolidate data from multiple sources into a single, intuitive interface. Our dashboards are built to empower clients with real-time insights, interactive analytics, and decision-making tools accessible globally via cloud platforms. Whether for operational monitoring, executive reporting, or customer-facing analytics, our solutions prioritize usability, scalability, and security.
2. Core Dashboard Development Services
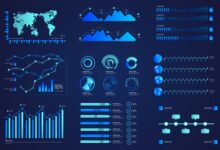
2.1 Custom Dashboard Design & Development
Description:
BD Tim Z Company creates bespoke dashboards aligned with client-specific workflows, branding, and KPIs.
Features:
- Tailored Layouts:
- Design dashboards for specific user roles (e.g., executives, analysts, field teams).
- Custom themes, color schemes, and branding elements.
- Interactive Widgets:
- Drag-and-drop charts, graphs, tables, and maps.
- Drill-down capabilities to explore granular data.
- Multi-Device Optimization:
- Responsive design for desktop, tablet, and mobile access.
2.2 Real-Time Data Dashboards
Description:
Develop dashboards that update dynamically as new data streams in, enabling proactive decision-making.
Features:
- Live Data Integration:
- Connect to APIs, IoT sensors, databases, and cloud services.
- Auto-Refresh Views:
- Set intervals for real-time updates (e.g., every 5 seconds).
- Alert Systems:
- Visual and email/SMS alerts for threshold breaches (e.g., inventory shortages).
2.3 Interactive Business Intelligence (BI) Dashboards
Description:
Build self-service BI dashboards that allow users to explore data without technical expertise.
Features:
- User-Friendly Interface:
- No-code filters, slicers, and parameter controls.
- Natural language querying (e.g., “Show sales by region in Q3”).
- Cross-Functional Analytics:
- Combine data from sales, marketing, HR, and operations.
- Export & Share Options:
- Export visualizations as PDFs, PPTs, or interactive web links.
2.4 Embedded Dashboards for Customer-Facing Apps
Description:
Integrate white-label dashboards into client applications or portals for end-user analytics.
Features:
- SDK/API Integration:
- Embed dashboards into SaaS platforms, client portals, or mobile apps.
- White-Label Customization:
- Remove BD Tim Z Company branding and align with client’s UI/UX.
- Multi-Tenant Support:
- Manage data access for different customer tiers.
2.5 Operational & IoT Dashboards
Description:
Monitor equipment, supply chains, or manufacturing processes with dashboards powered by IoT data.
Features:
- IoT Integration:
- Visualize sensor data (temperature, pressure, machine health) in real time.
- Use tools like Grafana or custom D3.js for industrial dashboards.
- Predictive Maintenance:
- Highlight anomalies and forecast equipment failures using ML models.
- Geospatial Mapping:
- Track assets, fleets, or facilities on live maps (e.g., Mapbox integration).
2.6 Executive & Strategic Dashboards
Description:
High-level dashboards for C-suite stakeholders to track organizational performance and KPIs.
Features:
- Strategic KPIs:
- Revenue growth, profit margins, customer retention, and market share.
- Scenario Modeling:
- “What-if” analysis tools to simulate business decisions.
- Data Storytelling:
- Combine visuals with annotations to explain trends.
5. Support & Maintenance
- Training: Workshops on dashboard customization and data exploration.
- 24/7 Monitoring: Proactive issue resolution and performance optimization.
- Scalability Upgrades: Expand storage, users, or features as needed.
8. Why Choose BD Tim Z Company?
- End-to-End Ownership: From data integration to deployment and support.
- Agile Development: Prototype in 4 weeks, full deployment in 12–16 weeks.
- Global Reach: Cloud-based access for teams in 100+ countries.
Contact Us: support@bdtimz.com